An error handling strategy to reduce money loss
How to prevent and mitigate errors through proper logging and the use of log management and monitoring tools. Concepts are technology-agnostic, but I provide an example with .NET Core C#, Sumo Logic and WebSitePulse.
How much does an error cost?
Proper logging
Prevention
Log search engine
Performance dashboard
Threshold alerts
Mitigation
Error alerts
Keepalive health check
Do I have an error handling strategy?
How much does an error cost?
I used to work for a book publishing company. Once a year the firm mounted a huge stand within the most important book fair in the country. I had contributed to the development of an ad-hoc Point of sale system for the checkout lanes. I was there at the opening when the program had a blocking error that prevented the cashiers from serving customers. While we were trying to solve the issue people started to abandon the lanes. The longer the error persisted the longer the lane grew, and so the more money the publisher lost.
At the time of writing I’m working for a technology services firm. I’m in charge of an API that is essential for the systems that support the sales process of the company. Recently we had an issue in Production that left us without database for two hours and affected 10,000 users approximately. How many business opportunities did the company lose during that downtime?
As we can see, errors equal money loss. Numbers will depend on the size of the organization and its revenue. According to the Aberdeen Group, the average cost of downtime for a Fortune 500 company is $686,250 per hour.
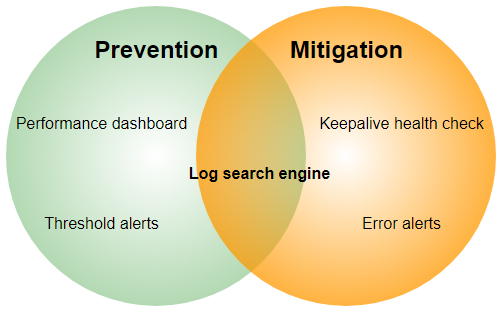
That’s why it’s critical to put in place an error handling strategy. The way I see it, an error handling strategy is the prevention and mitigation of errors, whose ultimate goal is to reduce money loss.
Prevention is the set of practices and tools which allow us to avoid errors.
Mitigation is the set of practices and tools which allow us to respond to errors in a timely manner, to find the root cause faster and to troubleshoot sooner.
Prevention includes the following elements:
- Log search engine: a single point of access to perform queries and analyze aggregated log data from multiple servers.
- Performance dashboard: a single page real-time user interface that provides an at-a-glance view of the system’s KPIs, such as average response time, number of requests per minute and errors in the last hour.
- Threshold alerts: a threshold alert is a warning message triggered after the expected limits for a certain metric are exceeded. For instance, an alert fired after a 75% increase in memory consumption over baseline.
Mitigation consists of the following items:
- Keepalive health check: an automated periodic call performed to the application in order to alert us if the system is unavailable.
- Error alerts: an error alert is a notification immediately sent when the failure takes place.

An error handling strategy
But, How can we bring into play all these sets of diverse practices and tools without dying in the attempt? Here is when Log management comes to the rescue:
“Log Management (LM) comprises an approach to dealing with large volumes of computer-generated log messages” (Log management).
LM allows us to put into action a successful error handling strategy, as it covers the sets of practices and tools needed to prevent and mitigate errors.
Fortunately, there are several products in the market which provide a comprehensive out-of-the-box Log Management solution. For example Sumo Logic, an SaaS offering, and Logstash, its open-source counterpart.
Proper logging in your code is a prerequisite to feed the LM tool and let it do its magic. From my experience, at least two points should be considered to get the most from the product:
- Logging generic information about every request: keeping track of data such as user, URI, HTTP response code and response time for each request our application receives will enable the “Threshold alerts” and “Performance dashboard” prevention tools.
- Catching all exceptions and logging relevant information about them: having in place a mechanism to ensure that exceptions, both handled and unhandled, are logged will enable the “Error alerts” mitigation tool. Registering data such as exception message, stack trace and user will help us to better understand errors and provide a solution rapidly.
Now that we have covered what an error handling strategy is about and what do we need to implement it, let’s see how can we leverage Sumo Logic Log Management tool in a .NET Core Web API REST service.
Keep in mind that this strategy is technology-agnostic. The same concept can also be implemented for instance with Logstash in Node.JS.
Logging in .NET Core Web API
Logging generic information about every request
As an example I coded a to-do API in .NET Core (you can find it in GitHub), that allows doing CRUD operations against an in-memory repository (e.g. creating a new to-do task, retrieving all the existing to-do tasks, etc). When an HTTP request arrives to the to-do API I use the LogEntry POCO (Plain Old CLR Object) to record generic information about it which, later on in the request pipeline, will be serialized and stored in Sumo Logic:
All the actions that are needed to log the request are performed by a middleware, a concept that was introduced in .NET Core:
“Middleware is software that’s assembled into an application pipeline to handle requests and responses” (ASP.NET Core Middleware).
The to-do API LoggingMiddleware starts a Stopwatch, saves the request data in LogEntry and invokes the next middleware in the pipeline. Before sending the response to the client, the same LoggingMiddleware calculates the time taken using the Stopwatch, populates the rest of the LogEntry attributes with the response data and finally calls the ILogger interface:
My first implementation of this idea was using .NET Framework 4.x instead of .NET Core. And in 4.x I used a DelagatingHandler to do what the LoggingMiddleware does.
The ILogger dependency is part of the Microsoft.Extensions.Logging .NET Core package. I configured it in the StartUp file to use Serilog, a third-party logging framework that provides a Sumo Logic sink. The sink is the one who actually takes care of writing the log events to the Log management tool.
It’s worth mentioning that there are plenty of alternatives for logging frameworks other than Serilog. For instance, at work I have an API that is using Log4Net. As this application is running in a set of virtual machines in AWS, Log4Net writes the logs to the filesystem and a Sumo Logic agent, which is installed in each box, is responsible for reading the log files and uploading them to the tool.
Catching all exceptions and logging relevant information about them
With the same approach as for logging requests, when an error happens I create an ExceptionLogEntry POCO to record all the relevant information about it:
The mechanism by which any unhandled exception is caught is implemented by the ExceptionHandlingMiddleware, which populates the ExceptionLogEntry with the details, writes a new error entry in the logs and return a clean HTTP 500 response to the client:
Log Management with Sumo Logic
Proper logging prerequisite is ready. The to-do API is now logging both successful and error requests and the Log Management tool is already being fed by our logs. Let’s go to Sumo Logic and setup each one of the prevention and mitigation elements to enable the error handling strategy.
Log search engine
Sumo provides a query language to dig into your logs called Search. A Search query consists of keywords and operators separated by pipes. Each operator acts on the results of the previous operator. The template for a query is:
keyword search | parse | where | group-by | sort | limit
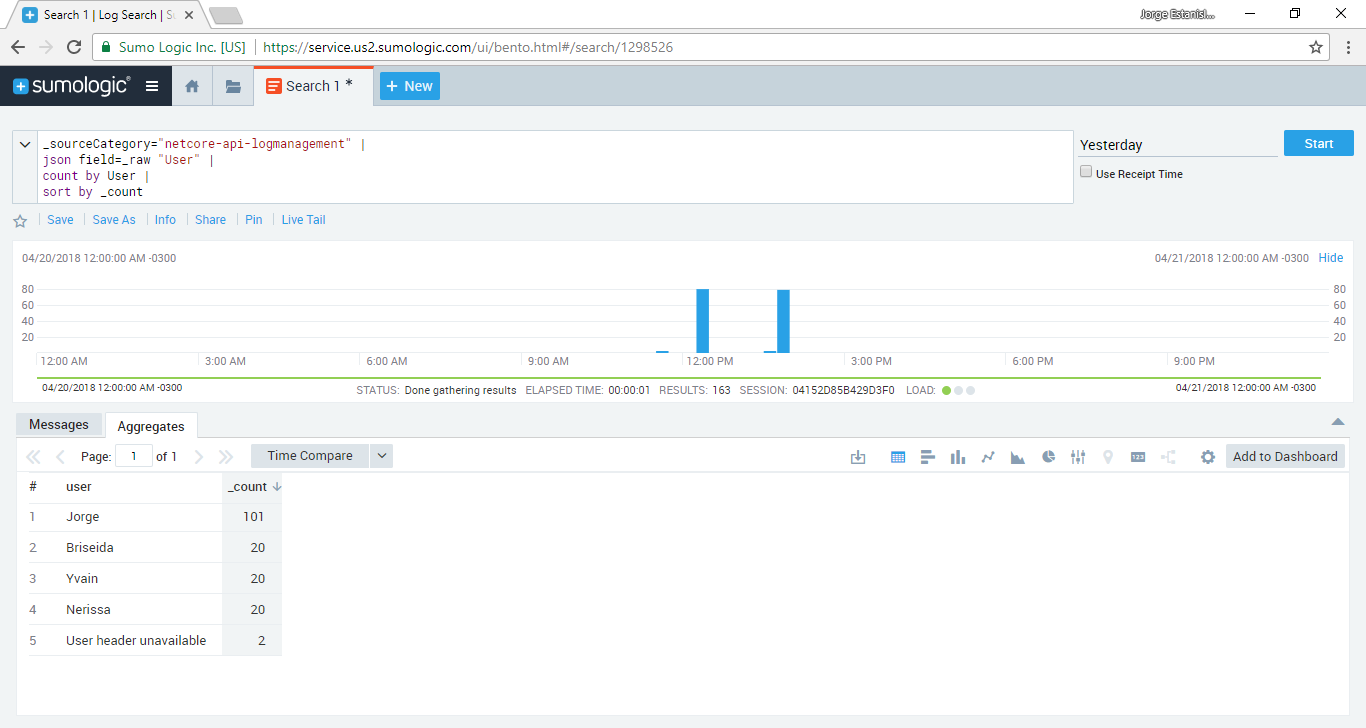
Example 1: Count and sort requests by the user who made the call to the API
_sourceCategory="netcore-api-logmanagement" |
json field=_raw "User" |
count by User |
sort by _count
The _sourceCategory is the identifier for our logs in Sumo Logic. Then the query parses out the user into a field, which is used to count and sort the results.
Example 2: Count requests that were made by a specific user
_sourceCategory="netcore-api-logmanagement" |
json field=_raw "User" |
where User matches "Jorge" |
count
The use of the where operator allows us to filter the results for a particular user and then count.
Search queries always have an specific time range to find messages in, for example the last 15 minutes. Sumo also provides time range expressions to define this window. For instance, “-3d” to specify “the last 3 days” or “2018/01/01 2018/01/03” to set the start and end dates for the search.
The log search engine is at the core of the error handling strategy. As other elements such as the Performance dashboard, the Error alerts and the Threshold alerts are built on top of queries.
Performance dashboard
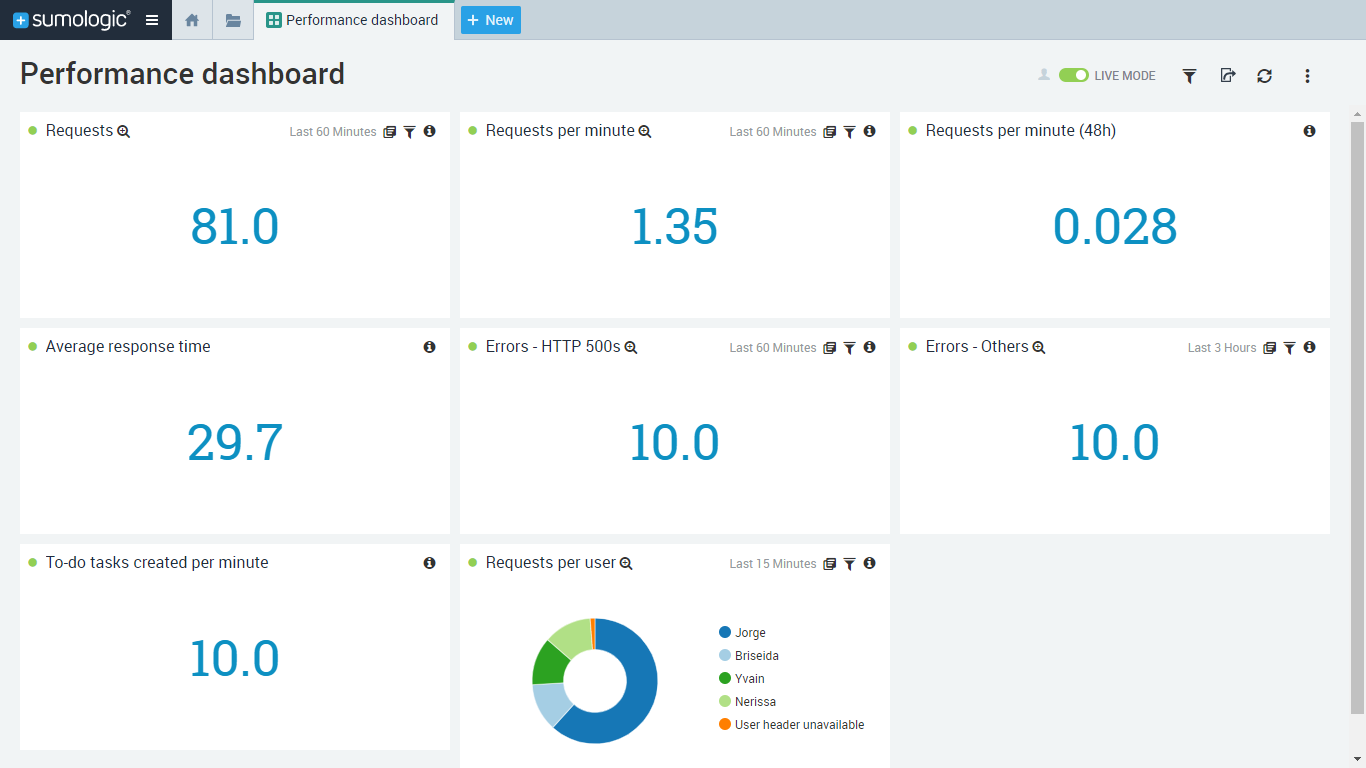
A dashboard in Sumo is a set of panels, where each panel shows a KPI -Key Performance Indicator- based on a Search query within a given time range. I usually create my dashboards to show the following:
Requests (-1h): total number of requests received in the last hour.
_sourceCategory="netcore-api-logmanagement" |
count
Requests per minute (-1h): average number of requests received per minute, within the last hour.
_sourceCategory="netcore-api-logmanagement" |
count as requests |
(requests / 60) as requests_per_minute |
fields requests_per_minute
Requests per minute (-48h): average number of requests received per minute, within the last 48 hours.
_sourceCategory="netcore-api-logmanagement" |
count as requests |
(requests / 48 / 60) as requests_per_minute |
fields requests_per_minute
Average response time (-1h): average server-side response time, based on the requests received within the last hour.
_sourceCategory="netcore-api-logmanagement" |
parse "\"TimeTaken\":*}" as TimeTaken |
avg(TimeTaken)
Errors – HTTP 500s (-1h): total number of internal server errors that happened in the last hour.
(_sourceCategory="netcore-api-logmanagement" AND ExceptionType) |
count
Errors – Others (-1h): total number of non-internal server errors such as bad requests that happened in the last hour.
_sourceCategory="netcore-api-logmanagement" |
parse "\"ResponseStatusCode\":*," as ResponseStatusCode |
where !(ResponseStatusCode matches "2*") AND !(ResponseStatusCode matches "500") |
count
To-do tasks created per minute (-1h): average number of to-do tasks created per minute, within the last hour. This is an example of a to-do “domain specific” metric, unlike the others that are more generic and can apply to any API.
_sourceCategory="netcore-api-logmanagement" |
parse "\"ResponseStatusCode\":*," as ResponseStatusCode |
where ResponseStatusCode matches "201" |
count
The “Live mode” feature allows the dashboard to be updated in real-time without reloading the page. You can have a monitor at your office to always display the dashboard with the metrics you are most interested in. Or if anyone asks about how the service is doing, you can open the dashboard and provide a responsive answer.
Error alerts
When you save a Search query, Sumo Logic allows you to schedule it to run automatically and trigger an email if certain conditions are met. For instance, we can use the same “Errors – HTTP 500s” Search query from our dashboard and set it up to be notified as soon as an internal server error occurs on our to-do API.
Threshold alerts
A good candidate for a threshold alert is performance monitoring. If we’re able to get notified as soon as the system starts working under its average speed, we have the chance to take action before things get worse. Before configuring the alarm we need a performance baseline. For that we can use the dashboard “Average response time” Search query with a long time range, let’s say -30d. The alert should be fired when the response time exceeds the baseline, e.g. 1000 ms, by a 25%:
_sourceCategory="netcore-api-logmanagement" |
parse "\"TimeTaken\":*}" as TimeTaken |
where TimeTaken >= (1000*1.25)
Also, Sumo lets you configure a message threshold to be alerted only if a certain number of requests, e.g. more than 50, is performing under the baseline.
Keepalive health check with WebSitePulse
The Keepalive health check is the only item in the error handling strategy that cannot be implemented by a log management tool such as Sumo Logic. For this one you’ll need another kind of product, capable of performing a periodic call to your service and notify you in case it’s down. One could be tempted to write a script to do this job, for example using PowerShell. I’d rather prefer a service such as WebSitePulse.com, which offers a much more robust solution than something I could build on my own:
- 24/7 remote monitoring “over the Internet”: to check if your servers are really available to your customers
- Different worldwide locations: to double-check failures and avoid false-positives, and also to see what’s the end-to-end performance for users from different places
- Multiple stations at diverse data centers: to enable high availability, so that if a primary server fails, one of the remaining servers will immediately take on the Keepalive health-check primary service
One of the WebSitePulse targets I have at work makes a request to an API every 5 minutes and it has been working for the last two years without interruptions. I receive an email when the API is down and other once it’s recovered. Also, I can suspend and resume the Keepalive health-check when there’s a planned downtime. Finally, WebSitePulse provides reporting about the availability of your service.
Do I have an error handling strategy?
Finally, I came up with a last tool which is a checklist that can be used to assess the error handling strategy in an existing application, or even in something you’re building from scratch and want to ensure you have the error handling covered:
- Do I have a single point of access to query and analyze the logs?
- Am I able to check the main performance metrics in real-time?
- Do I get notified when my app is working under the performance baseline?
- Do I get notified when there is an error?
- Do I get notified when my app is down?
To sum up, doing an estimate of how much money an error in your application might cost for your particular case is not an easy task. Beyond that specific number, I believe that the key of an error handling strategy is that ourselves, the developers (or any other role involved in building software), be aware of what impact an error in our systems can cause. At the end of the day, leveraging at least some of the error handling strategy elements not only will reduce the money loss but also will help to raise the quality bar of your system.

